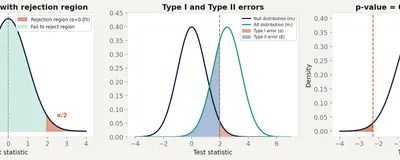
Most courses start with p-values. That's the wrong place to start. Here's the logical framework that makes hypothesis testing coherent, before a single formula appears.
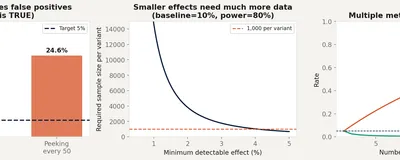
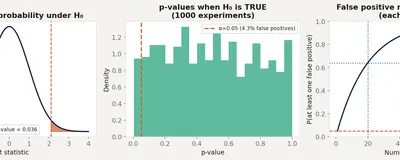
Why peeking at results inflates your false positive rate, how multiple metrics break your significance threshold, and the pre-experiment checklist that makes experiments trustworthy.
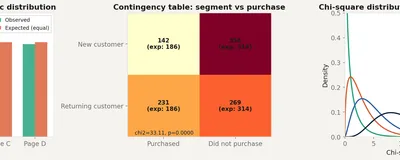
When your data is counts, not measurements. The goodness-of-fit test, the test of independence, and why categorical data needs its own statistical tools.
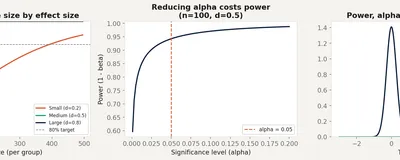
The false negative problem that most analysts ignore. What statistical power means, how to calculate required sample sizes before you run an experiment, and why 'no significant effect' often just means 'inconclusive test'.
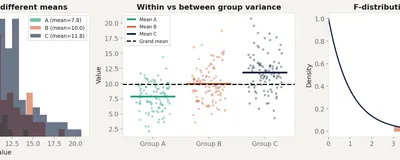
Why running three t-tests on three groups gives you a 14% false positive rate instead of 5%. How ANOVA tests all groups simultaneously with one F-statistic, and when to use post-hoc comparisons.
The most misused number in science. What a p-value actually measures, what it cannot tell you, why 0.05 is arbitrary, and how p-hacking turns null results into publications.
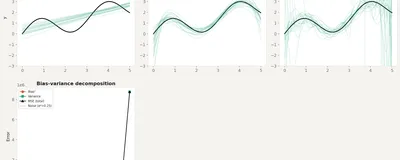
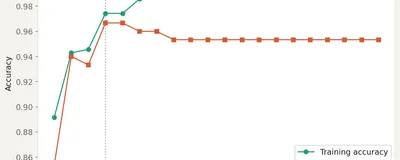
Why simple models miss patterns, complex models memorize noise, and the U-shaped curve that determines the sweet spot for every prediction problem.
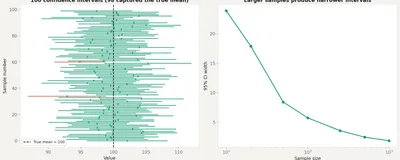
The most misinterpreted concept in applied statistics. What a 95% confidence interval actually claims, what it doesn't, and why the distinction matters for every decision you make from data.
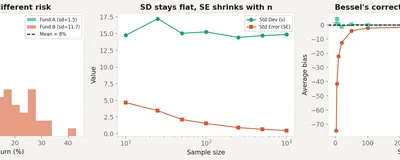
Variance, standard deviation, standard error, and Bessel's correction. What each one measures, how they differ, and when high variance is a feature, not a bug.
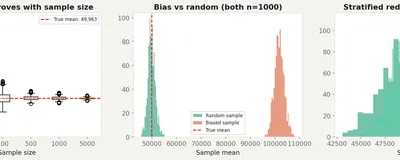
Random sampling, sampling bias, stratified sampling, and the standard error. Why 1,000 observations can represent millions, and why 10 million observations can get it completely wrong.
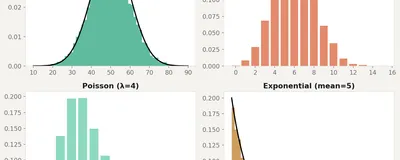
Normal, binomial, Poisson, exponential. What each one looks like, when data follows it, and what happens when you pick the wrong one.
Information gain, Gini impurity, and why a greedy split strategy produces trees that are surprisingly good at finding structure in data.
Most people know to look for p < 0.05. Fewer know what the test statistic is actually measuring or why the t-distribution has fatter tails than the normal.
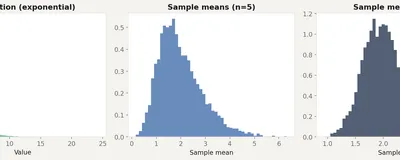
The CLT is the reason we can use normal distributions for nearly everything, even when the underlying data looks nothing like a bell curve.
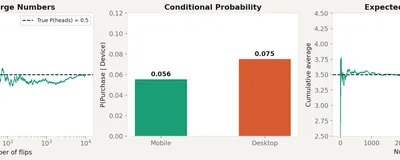
Random variables, conditional probability, expectation, and the three axioms that make all of statistics possible. The true starting point.